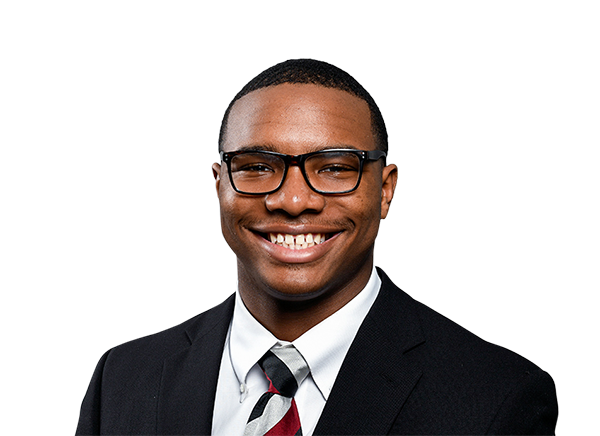
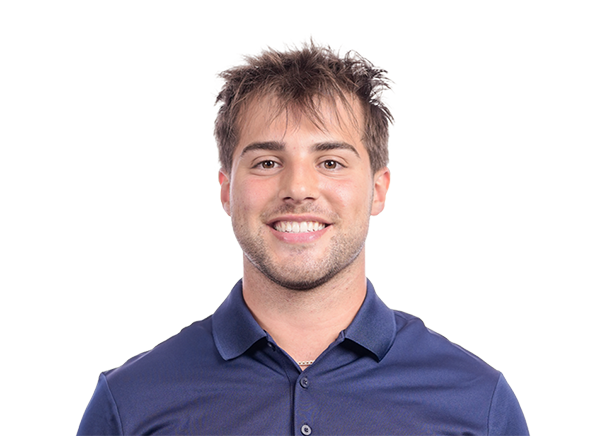
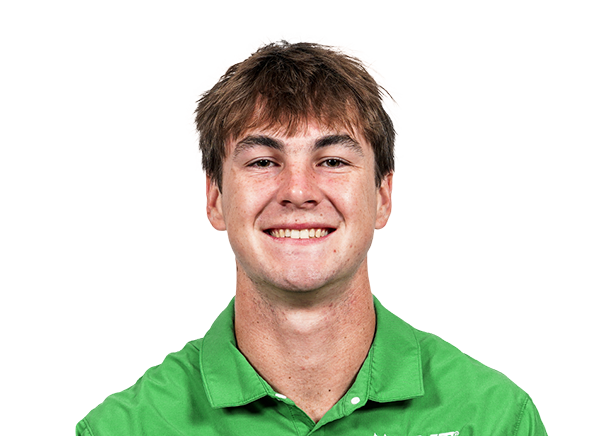
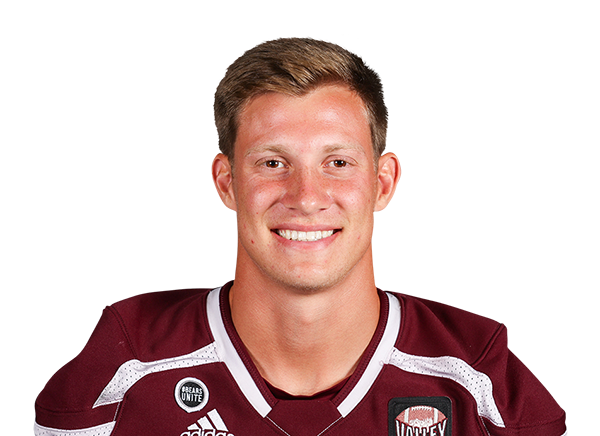
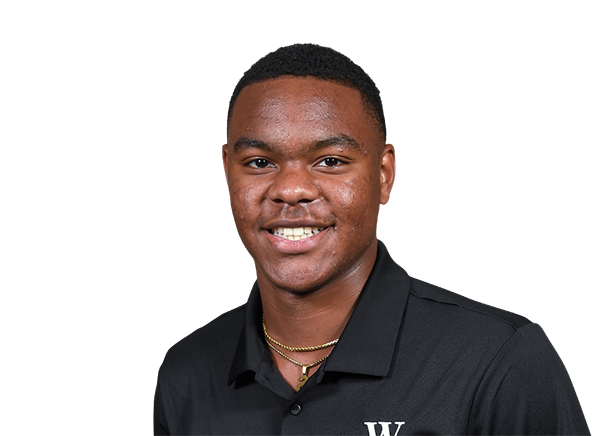
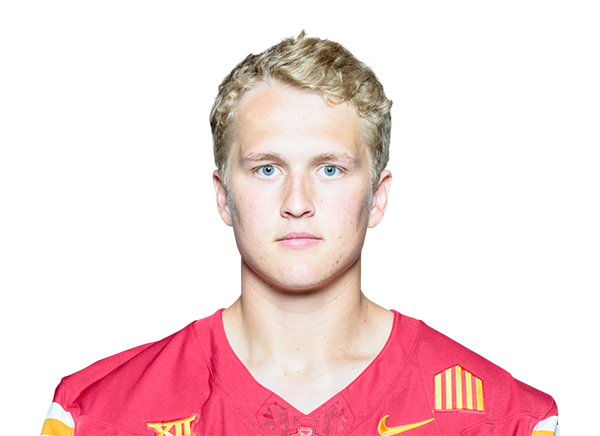
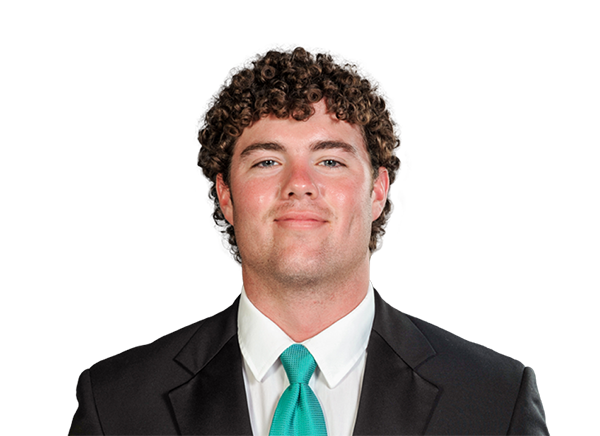
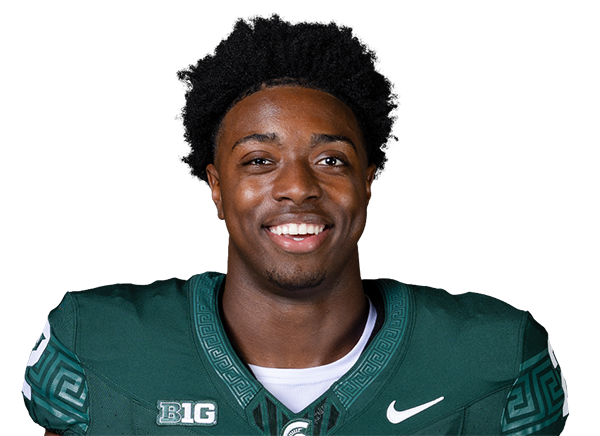
One dot per player, and the dot is his face. Players are only compared inside their own position group, and the workload floor keeps a monster number on twelve plays from masquerading as a star — it counts plays the player touched the ball, not snaps he was on the field for. The games floor defaults to four of a twelve-game season, because a rate earned in one game is not a measurement anywhere.
142 quarterbacks plotted · click a face for his full line
Quarterbacks — named reads
Yards / attempt vs EPA / dropback
2025 measured · all FBS · 200+ plays · 4+ games
Elite quadrant
high epa / dropback + high yards / attempt
Yards / attempt only
low epa / dropback
EPA / dropback only
low yards / attempt
Below on both
no champion has lived here
Heisman winners2025 Fernando Mendoza · 2023 Jayden Daniels · 2022 Caleb Williams · 2021 Bryce Young — the gold box is the range they occupied.
Outplaying the trend
Most yards / attempt above what their epa / dropback predicts.
Lanorris Sellers
QB · South Carolina · Yards / attempt 8.32
+1.52
Skyler Locklear
QB · UTEP · Yards / attempt 6.72
+1.39
Drew Mestemaker
QB · North Texas · Yards / attempt 9.40
+1.34
Thomas Castellanos
QB · Florida State · Yards / attempt 8.93
+1.19
Jacob Clark
QB · Missouri State · Yards / attempt 8.63
+1.12
C.J. Carr
QB · Notre Dame · Yards / attempt 9.35
+1.12
Amari Odom
QB · Kennesaw State · Yards / attempt 8.91
+1.09
Liam Szarka
QB · Air Force · Yards / attempt 10.78
+1.05
Falling short of it
Same workload, less to show for it — the fade side of the chart.
J.J. Kohl
QB · App State · Yards / attempt 6.78
-1.71
Tad Hudson
QB · Coastal Carolina · Yards / attempt 4.93
-1.44
Aidan Chiles
QB · Michigan State · Yards / attempt 6.86
-1.31
Carter Jones
QB · Nevada · Yards / attempt 5.79
-1.25
Evan Simon
QB · Temple · Yards / attempt 6.68
-1.07
Cameran Brown
QB · Georgia State · Yards / attempt 6.84
-1.07
E.J. Warner
QB · Fresno State · Yards / attempt 7.33
-1.06
Drake Lindsey
QB · Minnesota · Yards / attempt 6.12
-1.05
Passer efficiency vs receiver cost
142 passers · 2025
Right side = more throws reached his receivers and came back with no defender credited. This bucket contains drops AND off-target throws — nothing in any public feed separates them on a single play, so an inaccurate passer lands right on his own merits. The bottom-right corner is where the two explanations overlap; the board below holds the passer fixed and is the actual receiver-facing read.
Most hurt by one target
Spread between his worst and best qualifying receiver on his own throws — the same arm, so the difference is far more likely the receiver than the throw.